Stocks
Will your 2x and 3x ETFs Pay? Try My Free Leverage Lab
A benchmark can finish exactly where it started while a leveraged ETF ends lower. Seeing the daily moves makes the difference much easier to understand. I built Leverage Lab to make that math visible. It is a free simulator for exploring daily leverage, compounding, and position sizes. You can compare 2x and 3x daily objectives, […]
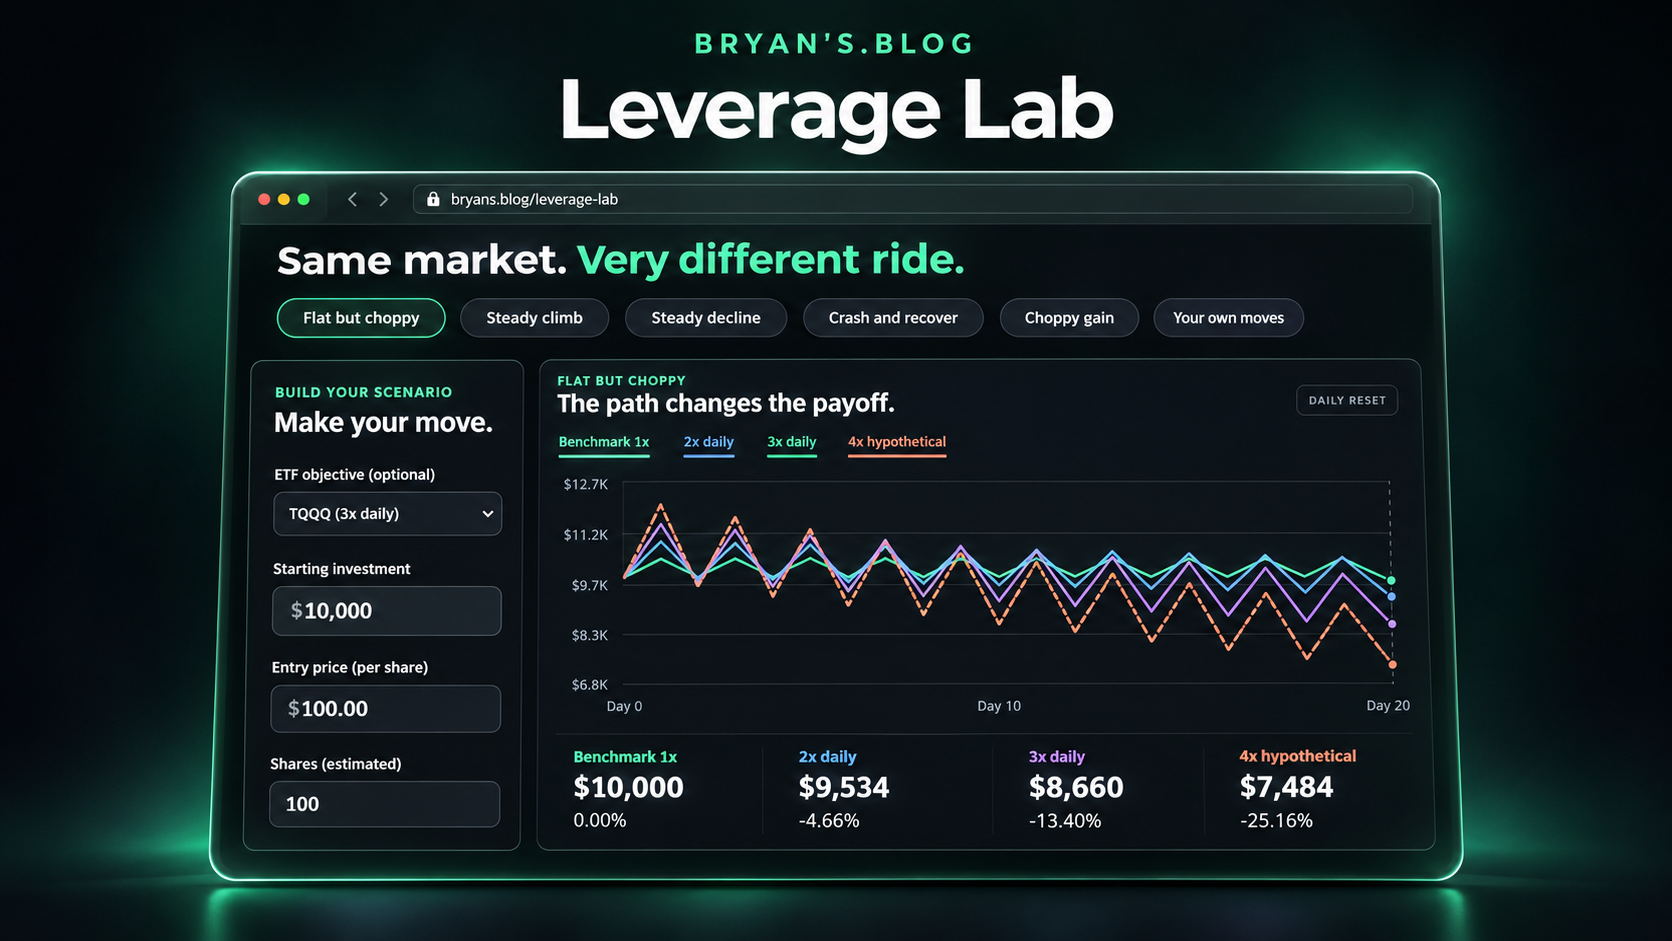
A benchmark can finish exactly where it started while a leveraged ETF ends lower. Seeing the daily moves makes the difference much easier to understand.
I built Leverage Lab to make that math visible. It is a free simulator for exploring daily leverage, compounding, and position sizes. You can compare 2x and 3x daily objectives, add a hypothetical 4x comparison, and move through the results one day at a time.
The full tool is embedded below. Choose from a directory of 50 ETFs, load an available closing-price reference or enter your own purchase price, and see what your investment amount means in estimated shares and simulated dollars.
It also lives on my Stocks page, alongside the latest market stories and sector coverage. No account is required to use it.
Start with a ticker, a price, and an amount
Select an ETF from the menu or searchable directory. The tool sets its daily leverage and long or inverse direction. The collection includes sector and thematic funds such as SOXL, NAIL, and UTSL, broad-market funds such as TQQQ, and a selection of international, Treasury, and single-stock ETFs.
Use Load latest close for the latest available completed closing-price reference, or type your own entry price. The reference shows its trading date and source. It is not a live quote, and manual entry remains available if the feed cannot return a price.
Enter an investment amount to see estimated fractional shares. As you explore a market path, the position panel updates the simulated share price, position value, and profit or loss. Fractional shares are assumed; actual broker support and execution may differ.
The entry price establishes how many shares the amount represents. It does not change the chosen hypothetical percentage returns or predict the next market move.
Why a flat market can still produce a loss
A daily leveraged objective applies to each day’s benchmark return. The next day starts from the new balance. That makes the compounded result different from simply multiplying the benchmark’s total return by two or three.
Consider a benchmark that rises 10%, then falls by about 9.09%, returning to its starting level. Starting with $100, these are the simplified outcomes before costs:
| Daily exposure | Start | After the rise | After the reversal |
|---|---|---|---|
| Benchmark 1x | $100.00 | $110.00 | $100.00 |
| 2x daily | $100.00 | $120.00 | $98.18 |
| 3x daily | $100.00 | $130.00 | $94.55 |
| 4x hypothetical | $100.00 | $140.00 | $89.09 |
The second benchmark move is exactly the return needed to reverse the first gain. Values above are rounded to cents. This is an illustrative calculation, not historical fund performance.
Try Flat but choppy in the tool to see that effect across more days. Then compare it with Steady climb. Compounding does not always reduce a leveraged return: a persistent trend can produce a result above a simple multiple of the benchmark’s total gain before costs.
A few useful experiments
- Crash and recover: Bring the benchmark back to its starting point and compare what remains in the leveraged positions.
- Long versus inverse: Keep the benchmark moves the same and flip the direction of the daily objective.
- Your own moves: Enter daily benchmark percentage changes to explore a specific hypothetical sequence. These should be benchmark moves, not already leveraged ETF returns.
- The smoother path: Keep the benchmark’s final return and number of days identical, then compare the results with constant daily moves.
The timeline lets you inspect each day’s balance. You can also open the daily ledger, export a CSV, save a result image, or copy a scenario link. Shared scenarios retain their saved entry price as a snapshot; use Load latest close if you want a newer reference.
What this tool can and cannot tell you
Leverage Lab demonstrates mechanics. Its 50-fund directory is a curated collection, not a ranking of the best investments. Selecting a ticker applies its daily objective to your scenario; it does not load a historical backtest or reproduce that fund’s actual performance.
The 4x line is hypothetical. It is included to make the sensitivity to leverage easier to compare, and is not presented as a named ETF available through your broker.
You can add a common illustrative annual drag to the leveraged lines. Actual fund results also reflect financing, tracking differences, trading costs, distributions, and other factors that this simplified model does not reproduce. The model’s zero boundary is explained inside the tool.
Leveraged and inverse products can produce substantial losses. For the underlying mechanics and risks, read the SEC’s investor bulletin and FINRA’s guide to leveraged and inverse products. The simulator is educational and does not provide a trading recommendation.
Move the numbers. Watch the difference.
Start with a flat but choppy market, switch to a steady trend, then try an amount and entry price of your own. The useful part is seeing how the same daily objective behaves across different market conditions.
Closing-price references are supplied through Yahoo Finance when available and may be cached or delayed. Check the displayed trading date. Simulated outcomes are hypothetical, not predictions. Educational content, not personalized investment advice.

Written by
Bryan
Independent technology coverage focused on useful context, real-world experience, and honest recommendations.